
Being in poverty means different things to different people. That’s one of the reasons we have so many possible ways of measuring it in the UK.
So one of the most valuable questions to ask anyone who makes claims on this topic is: what do you mean by poverty?
In this article, we’ll discuss the main “recognised” definitions of poverty in the UK that you’ll see used in the media, by campaign groups and by politicians. But there will be others we won’t go into detail about here.
Often it helps not to become too wedded to specific numbers—there are a lot of judgement calls that go into drawing the line between someone in poverty and someone who isn’t, and it won’t always match with what you think of as poverty. Sometimes just looking at the trend over time can be valuable instead, because whatever definition is being used, an increasing poverty trend over time is a strong indication that something is getting worse for some groups of people, and vice-versa if the trend is going down.

The poverty figures you’ll often seen quoted are also usually ‘snapshots’ – they show how many people are in poverty at a given time. That’s only part of the story, because poverty is a temporary experience for some and a long-term situation for others. So it also helps to look at measures of persistent poverty which picks out people who’ve been in poverty for long periods.
In any case, it helps to treat with scepticism any claim that paints poverty as a single number or trend. The chances are there will be another measure or perspective that paints a different or more nuanced picture.
Defining poverty
There are two broad things you need to decide when defining poverty: what you’re going to look at in people’s lives, and how you’re going to define the threshold between who’s in poverty and who isn’t.
Firstly, poverty is not quite the same thing as having low income. People and families can have different fixed costs to contend with as well, like childcare, housing and costs associated with disability, as well as different levels of savings or assets to draw upon.
Different measures of poverty capture different things—some are just about people’s incomes, others take housing costs into account, and some define material essentials people need for a decent standard of living, like warm clothing and basic holidays. Newer options also try to bring fixed costs and savings into the mix as well.
Once you decide what you’re going to count, the next question is how you’re going to go about drawing a “poverty line”.
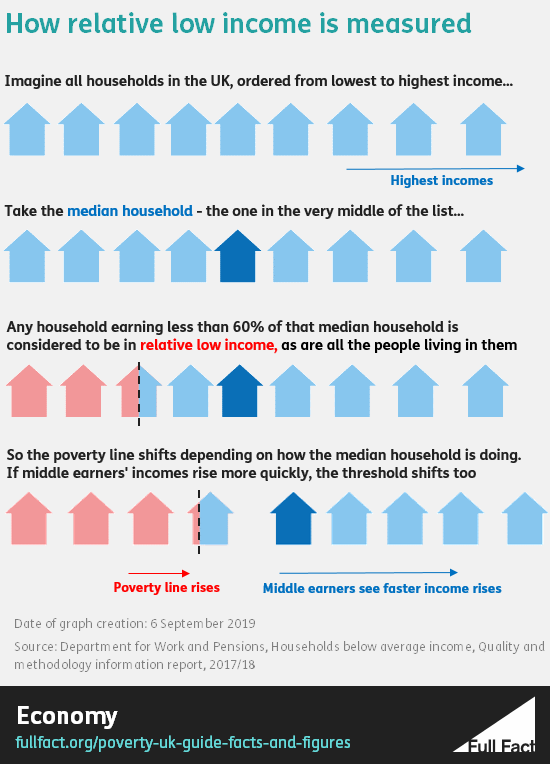
One approach to this is to look at the resources people have and compare them to what everyone else has (these are known as “relative measures”). The people at the bottom end are considered to be in poverty in comparison to everyone else.
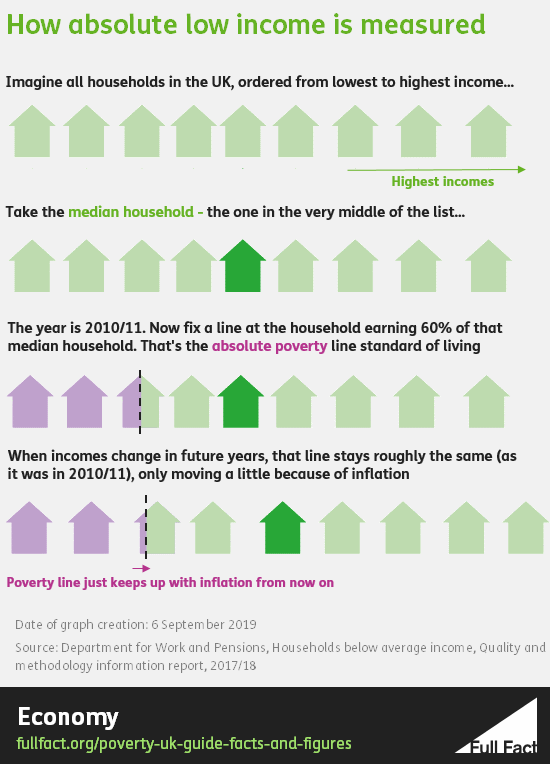
Another approach is to define a fixed set of resources, perhaps by defining a set of essentials people need to have in order to have a decent standard of living (known as “absolute measures”). Anyone who can’t afford that standard is considered to be in poverty, regardless of what everyone else has.
The definition used by a number of international organisations (such as the UN and the World Bank) is that you cannot afford the basic needs of life—food, clothing, shelter and so on.
A new way of measuring poverty
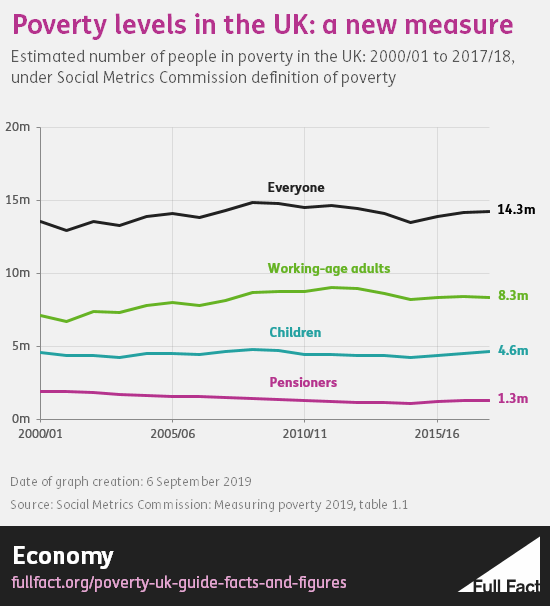
One of the most comprehensive measures of poverty on offer at the moment is produced by the Social Metrics Commission (SMC). The SMC is an independent group of experts who have been working to improve the way we understand and measure poverty in the UK, which has been publishing estimates since 2018.
They found that in 2017/18:
- An estimated 14.3 million people are in poverty in the UK
- 8.3 million are working-age adults, 4.6 million are children, and 1.3 million are of pension age
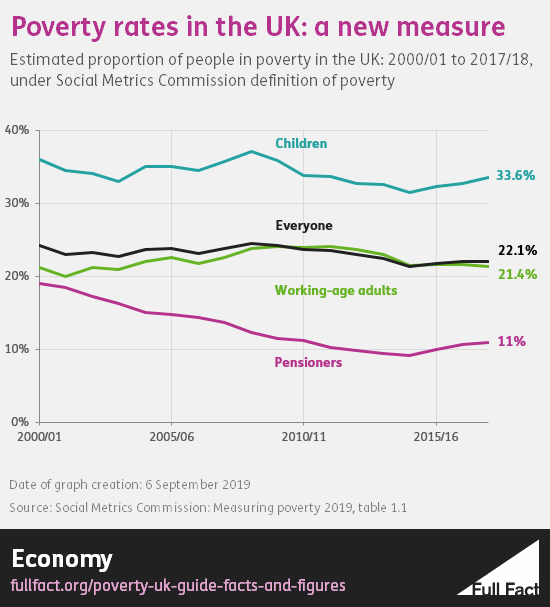
- Around 22% of people are in poverty, and 34% of children are
- Just under half (49%) of those in poverty are in “persistent poverty” (people who would also have fallen below the poverty line in at least two of the last three years). This is as of 2016/17
- Working-age people in poverty are increasingly likely to be in working families
- Most poverty rates aren’t all that different to what they were at the start of the 2000s. The most marked reduction has been in pensioner poverty, it is almost half as common as it was back in 2000, while rates for working-age adults are now slightly higher
- Poverty rates fell in the years after 2010, as the UK recovered from the financial crisis, but are now showing clear signs of rising again
So what choices have the SMC made when it comes to defining poverty?
Firstly, they’re counting a whole range of costs and assets a family has access to—more so than most other measures. They take into account people’s incomes, housing and mortgage costs, childcare, costs associated with disability, and accessible savings. They also include rough sleepers in their measure and account for people who live in overcrowded housing.
They look at families (related individuals in the same household) rather than individuals because families tend to share resources, so say this should be reflected in a measure of poverty. But they don’t just count whole households, because sometimes people who aren’t related share accommodation (like lodgers, or students in halls) and don’t always share resources.
Secondly, they’re using a kind of relative poverty measure, comparing families across the UK. This means they’ve chosen to compare everyone to an “average” family in terms of the resources they have available to them, and those who have the least by comparison are defined as in poverty.
They effectively place all families in the UK in a line, from those with the most resources to those with the least. The family in the middle is the “median family”. Any family that has 54% or less of what that median family has is defined as being in poverty.
Why 54%? Actually, the SMC itself openly admits this is a “largely arbitrary” choice. It’s actually chosen so that there’s almost no difference in the overall level of UK poverty between this new measure and the existing ones used by the government. The main measure of relative poverty shows as many as 14 million people in poverty—this new measure has it at 14.3 million, due to this choice.
Changing that threshold makes a stark difference too—using the previous year’s figures if you made it 50%, you’d have “moved” 2.5 million people out of poverty. If you went for 60%, you’d have increased poverty by 2.3 million people.
That’s also why the SMC pays close attention to people who fall very close to that poverty line, and seeks to keep track of how deeply people are in poverty, and how persistently over time.
But it’s also why you need to treat the precise numbers they show with caution, because they could so easily be different with the slightest change in judgement for where to draw the line.
The existing ways of measuring poverty
The SMC’s work is still relatively new in this field, and you’ll probably most often see numbers quoted from the government’s official data on households below average income, which comes from a survey and is published by the Department for Work and Pensions.
This data only shows poverty in terms of people’s household income—from earnings and benefits—taking off things like taxes, pensions, student loans and child support payments. It also has a set of figures which deducts housing costs like rents, mortgages and water rates.
It’s worth noting that (as we’ll explain further down) there are some reasons to suspect that these figures may overestimate the number of people in poverty due to the way the data is collected.
Here there are two main choices of measure—relative and absolute low income, and a further specific measure called ‘material deprivation’ for children and pensioners.
Relative low income is exactly as described above, except here the government draws the line at households with below 60% of the median household income as the main measure.
Absolute low income is a lot like the relative measure, except instead of comparing households to the median household in the current year, it compares them to the median household as it was in 2010/11. To account for the fact that the price of things in shops tends to rise over time, it also adjusts for inflation. 2010/11 is just an arbitrary year to choose. The point is that it’s a fixed standard to compare people’s incomes to, rather than everything always being relative to how everyone else is doing.
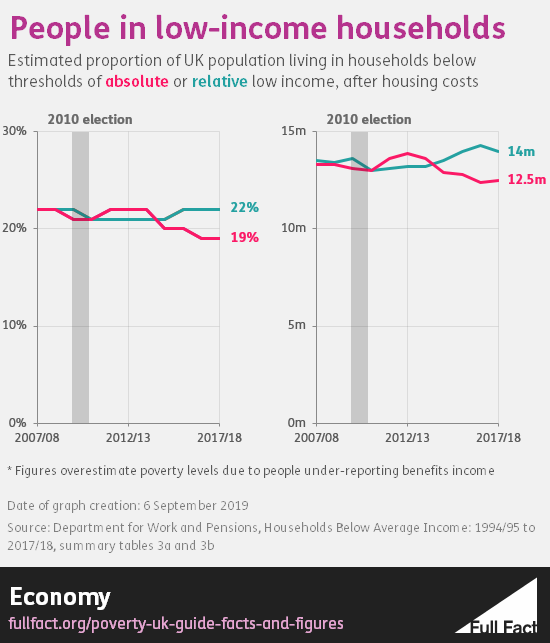
Here’s what those figures say, as of 2017/18, taking people’s housing costs into account:
- An estimated 14 million people in the UK are in relative low income, or 12.5 million in absolute low income
- That’s 22% of the public in relative low income, and 19% in absolute low income
- On either measure, working-age households in low income are increasingly likely to be in some kind of work. Well over half of households on both measures have somebody in work
- Most of the measures—with our without housing costs—have increased slightly in the last year
- Since 2010, relative low income has generally risen while absolute low income has generally fallen
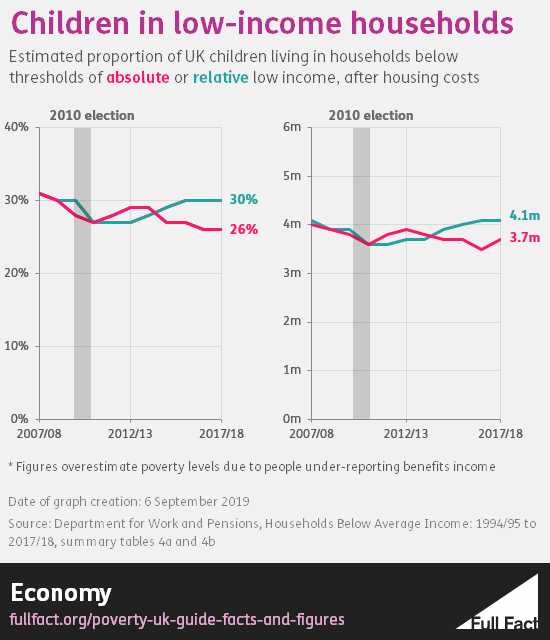
For children:
- An estimated 4.1 million children live in a household in relative low income, or 3.7 million in absolute low income
- That’s 30% of children on the relative measure, and 26% of children on the absolute measure
- Around 70% of children in low income live in a household where someone works, on either measure. As with the population as a whole, this is on a rising trend
- Most of the measures—with our without housing costs—have increased in the last year
- Since 2010, the proportion of children in relative low income households have generally risen, while those in absolute low income have mainly stayed the same
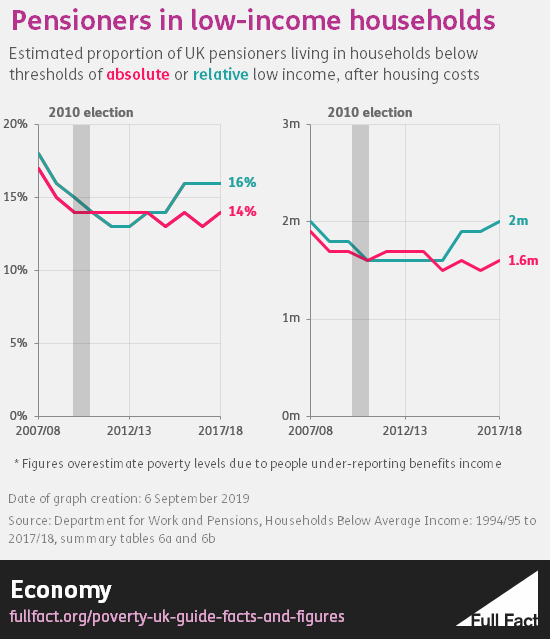
For pensioners:
- An estimated two million pensioners in relative low income, or 1.6 million in absolute low income
- That’s 16% of pensioners on the relative measure, and 14% on the absolute measure
- All of the main measures—with our without housing costs—suggest a slight increase in the last year
- Since 2010, there are more pensioners in relative low income, and roughly the same in absolute low income
For children and pensioners, there’s an additional measure which looks at material deprivation. This identifies tangible things that families can’t afford, like warm clothes in the winter, social contact and holidays. Households that score badly on these measures, combined with being in low income overall (for children), are considered to be “in low income and material deprivation”.
Those figures show, for 2017/18:
- 12% of children are in low income and material deprivation, which increased slightly in the past year. Since 2010, the trend has been fairly flat
- 7% of pensioners are counted as materially deprived. That’s unchanged in the past year and has been on a downward trend since 2013/14
But those figures may be too high
Actual levels of low income are probably a bit lower than these official figures suggest.
That’s because the figures all come from a survey, and households tend to under-report how much they receive in benefits.
Analysis by the Resolution Foundation think tank has shown that the total benefits people report receiving don’t match the actual amount of government spending on benefits.
It estimates that the true poverty rates, using these low income measures, are significantly lower once you try to account for this. In 2016/17, relative low income rates, including housing costs, would have fallen from 22% to 18%, for children from 30% to 24%, and for pensioners from 16% to 11%.
The research also suggests child poverty rates fell more significantly in the early 2000s than official figures suggest. On the other hand, the rises since 2011 may have been faster than suggested by official figures.
The government is planning a new way of measuring poverty
The government announced this year plans to develop a new measure of poverty in the UK, using the research last year from the Social Metrics Commission as a starting point and building upon it.
It plans to publish the new measure in 2020, alongside the low income indicators it already produces.
This doesn’t necessarily mean the government is bringing in a new target for reducing poverty. Legally-binding child poverty targets based on low income were removed by the government in 2016, and there aren’t currently any plans to introduce any.
It’s too early to say what exactly the new measure of poverty will look like, but it’s likely to give us a fuller picture about what’s happening to poverty in the UK


No Comment